Statistics of Catholic Church in Iraq
As of December 31, 2019 (from Central Office for Church Statistics)

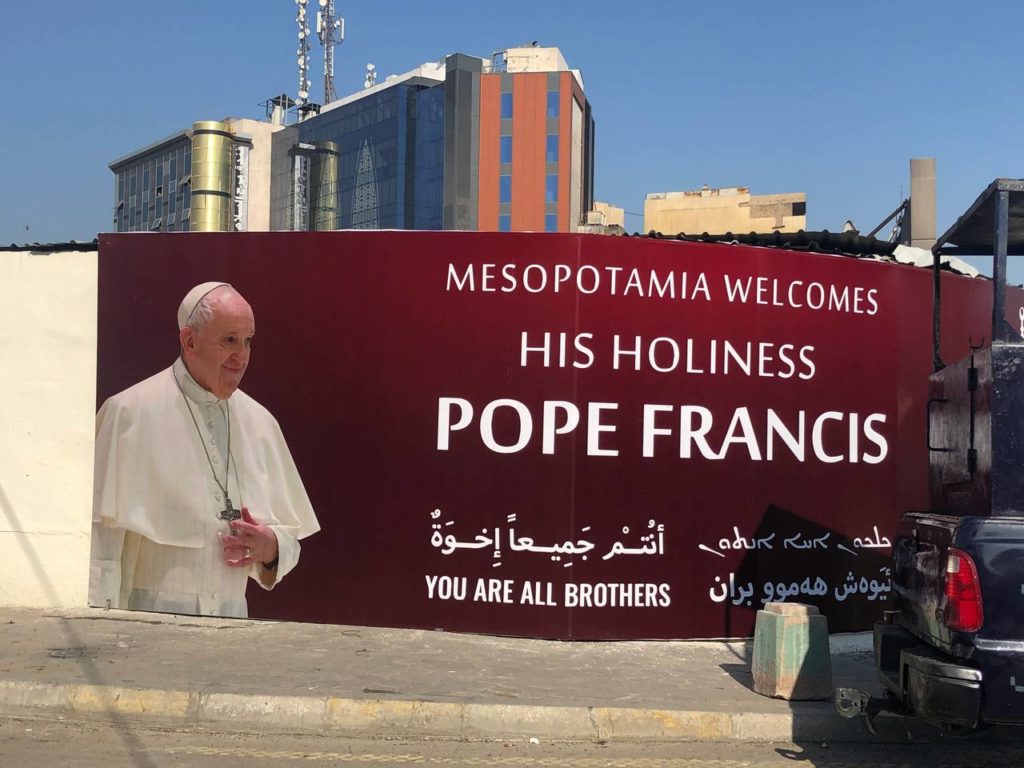
Here are the statistics of the Catholic Church in Iraq as of December 31, 2019 (from the Central Office for Church Statistics), released March 2, 2021, by the Vatican.
EXCLUSIVE INTERVIEW: Cardinal Sandri: Pope in Iraq, ‘Hope for Martyred Church’
Table 1 – Population and ecclesiastical structure
Table 2 – People engaged in activities of the apostolate
Table 3 – Indicators of pastoral workload
Table 4 – Priestly vocations
Table 5 – Educational centers owned / managed by ecclesiastics or religious
Table 6 – Charitable and social centers owned / managed by ecclesiastics or religious
Table 1 – Population and ecclesiastical structure
| Area (km2) | 438,317 | |
| Population (in thousands) | 38,836 | |
| Density (inhabitants/km2) | 89 | |
| Catholics (in thousands) | 590 | |
| Catholics per 100 inhabitants | 1.5 | |
| Ecclesiastical circumscriptions | 17 | |
| Parishes | 122 | |
| Other pastoral centers | 12 | |
| Catholics per pastoral center | 4,406 |
Table 2 – People engaged in activities of the apostolate
| Bishops1 | 19 | |
| Diocesan priests | 113 | |
| Religious priests | 40 | |
| Total priests | 153 | |
| Permanent deacons | 20 | |
| Men religious (other than priests) | 8 | |
| Professed women religious | 365 | |
| Members of secular Institutes | – | |
| Lay missionaries | 4 | |
| Catechists | 632 |
[1] Situation on 31.12.2020
Table 3 – Indicators of pastoral workload
| Catholics per priest | 3,856 | |
| Catholics per pastoral worker | 491 | |
| Priests per pastoral center | 1.14 | |
| Priests per 100 people engaged in activities of the apostolate | 14.3 |
Table 4 – Priestly vocations
| Minor seminarians | 11 | |
| Major seminarians | 32 | |
| Major seminarians per 100,000 inhabitants | 0.08 | |
| Major seminarians per 100,000 Catholics | 5.4 | |
| Major seminarians per 100 priests | 20.9 |
Table 5 – Educational centers owned / managed by ecclesiastics or religious
| Schools: | ||
| Pre-school and primary | 55 | |
| Lower middle and secondary | 4 | |
| Higher and university | 9 | |
| Students in: | ||
| Pre-school and primary schools | 5,464 | |
| Lower middle and secondary schools | 770 | |
| Higher and university institutes | 378 |
Table 6 – Charitable and social centers owned / managed by ecclesiastics or religious
| Hospitals | 7 | |
| Clinics | 6 | |
| Leper colonies | – | |
| Homes for the elderly and disabled | 5 | |
| Orphanages and nurseries | 10 | |
| Family consultation centers | 1 | |
| Special centers of social education or rehabilitation | 1 | |
| Other institutions | 5 |
Related

“Priests as Bearers of Hope”: Pope Francis’ Call at the Chrism Mass
Exaudi Staff
17 April, 2025
1 min

Pope Francis’ Catechesis: God always comes to find us!
Exaudi Staff
17 April, 2025
5 min

Francis calls for facilitating faith travel: “Young people and families cannot be left behind”
Exaudi Staff
17 April, 2025
1 min

Pope Francis in active recovery: preparing the meditations for the Stations of the Cross while delegating the liturgies of the Triduum
Exaudi Staff
16 April, 2025
2 min
 (EN)
(EN)
 (ES)
(ES)
 (IT)
(IT)

